Demo Gallery
Visual walkthrough of the NYC Taxi Zone Recommendation platform.
Scenario: Rainy Friday Evening in Manhattan
The problem
A taxi driver finishes a drop-off in Midtown at 7:30 PM on a rainy Friday. Without guidance, the driver cruises randomly, wasting fuel and time.
Before AI guidance:
Driver circles Midtown for 20 minutes
Finds passenger heading to Brooklyn ($18 fare)
35% utilization across the shift
~$350 daily revenue
AI decision process
Step 1: Demand forecast → JFK airport demand spikes at 8 PM (rain + Friday)
Step 2: Travel time matrix → 35 min from Midtown to JFK via highway
Step 3: Two-step horizon planner → Go to JFK now, pick up airport fare, reposition to Manhattan
Step 4: Recommendation → [JFK Zone 132, Upper East Side Zone 140, Midtown Zone 161]
The result
After AI guidance:
Driver heads to JFK, picks up $62 airport fare within 10 minutes
Then repositions based on next forecast window
52% utilization across the shift
~\(570 daily revenue (+\)220/day vs cruising)
Benchmark Dashboard
Static diagnostic (3,360 queries)
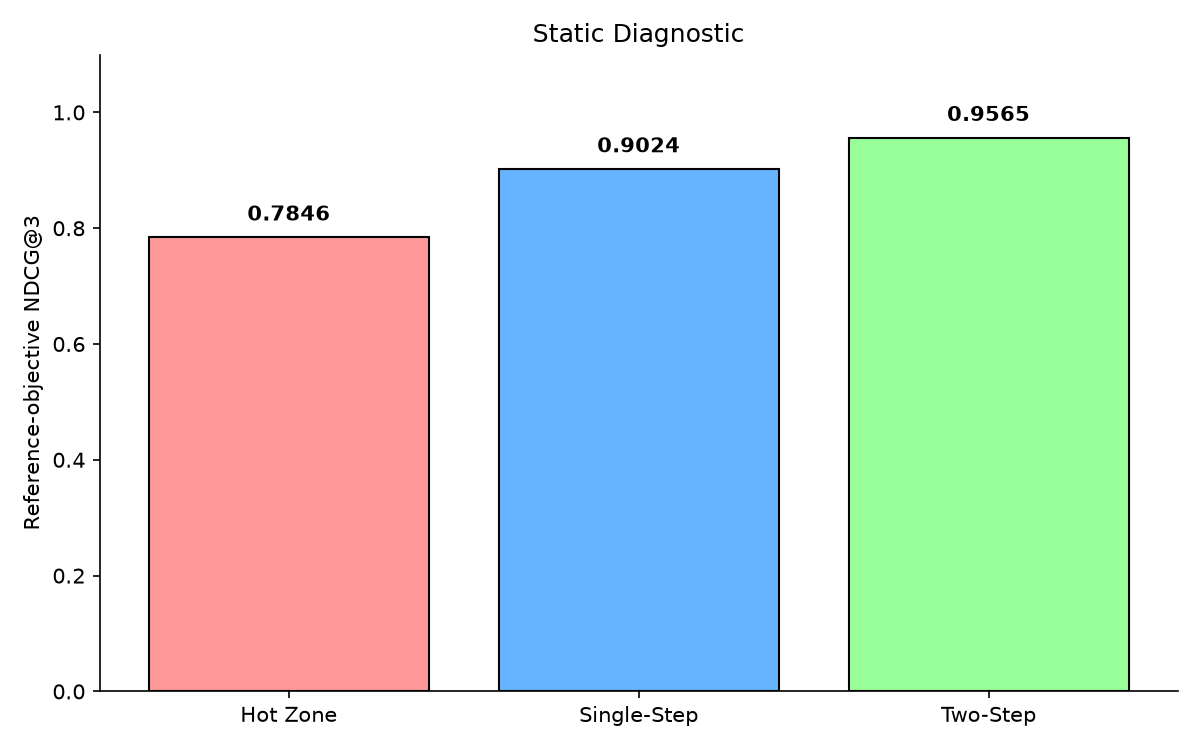
The Two-Step Horizon strategy achieves 0.9565 NDCG@3 on public validation queries — a 21.9% improvement over the naive Hot Zone baseline.
Rollout performance
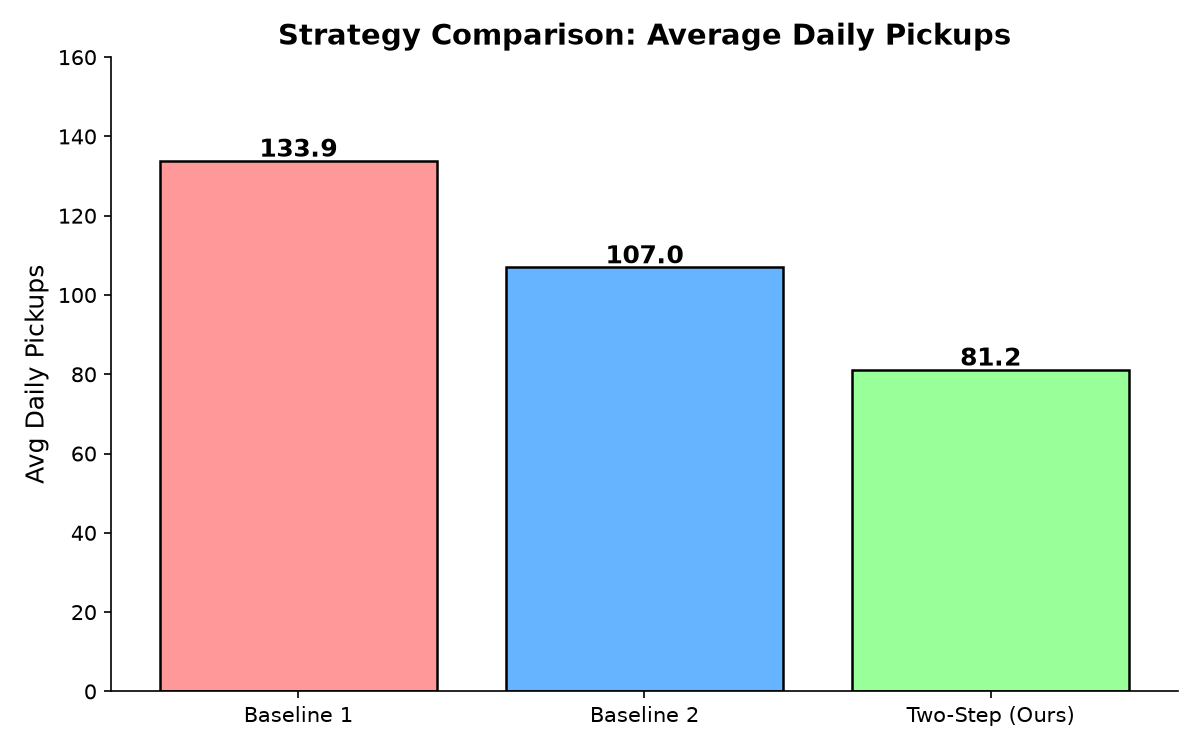
100-seed paired rollout shows consistent improvement: Two-Step delivers +$139/day vs Hot Zone, with the improvement concentrated in the 7-10 AM and 6-9 PM peak windows.
Multi-agent competition
The multi-agent simulator reveals that as fleet size grows, simpler strategies degrade faster than horizon-aware policies. At 50 drivers, Two-Step maintains a +$25/day advantage over Single-Step.
NYC Map Visualization
The project uses NYC’s 263-taxi-zone geography. All-pairs travel times are precomputed via Dijkstra on a directed OD graph built from 1.8M+ training trips.
        Manhattan (Zones 100-199)
        ┌──────────────────────────┐
        │  Upper East   Upper West │
        │  ┌────┬────┐ ┌────┬────┐ │
        │  │140 │141 │ │142 │143 │ │
        │  └────┴────┘ └────┴────┘ │
        │  Midtown                 │
        │  ┌────┬────┐             │
        │  │161 │162 │   → Queens  │
        │  └────┴────┘      (JFK)  │
        │  Downtown          ↓     │
        │  ┌────┬────┐     ┌───┐   │
        │  │113 │114 │     │132│   │
        │  └────┴────┘     └───┘   │
        └──────────────────────────┘
Reproducibility
All results in this gallery are reproducible. Run:
make all          # Full pipeline
make static       # Static diagnostic only
make combined-benchmark  # Combined report
All metrics are checked in as reference snapshots in outputs/ with timestamped validation.
More scenarios
Scenario |
Time |
Weather |
AI Decision |
Outcome |
|---|---|---|---|---|
Monday morning rush |
8:15 AM |
Clear |
Upper East → Midtown |
Commuter demand |
Saturday night |
11:00 PM |
Clear |
Greenwich Village → Meatpacking |
Nightlife flow |
Airport surge |
4:00 PM |
Thunderstorm |
JFK → Manhattan |
Airport backlog |
Holiday eve |
6:00 PM |
Snow |
Penn Station → residential |
Transit hub exit |